Debugging #
One of the questions that occurred to me during the course of this project was what is the gs register and how does it work? I was familiar with the “standard” CPU registers like eax and rax for 32 bit and 64 bit architectures, but I had not heard of gs. This is what I found out.
Most CPUs currently have a set of special registers called Model Specific Registers (MSRs). These registers are reserved for use in only the OS kernel, meaning the kernel is responsible for what the register does and how it functions. This is where the gs and fs registers come into play because they are segment registers reserved for some of those MSRs. In Microsoft systems, the gs register is used to point to the TEB in 64 bit systems and the fs is similar but for 32 bit systems. I of course, pulled out the debugger to see this in action:
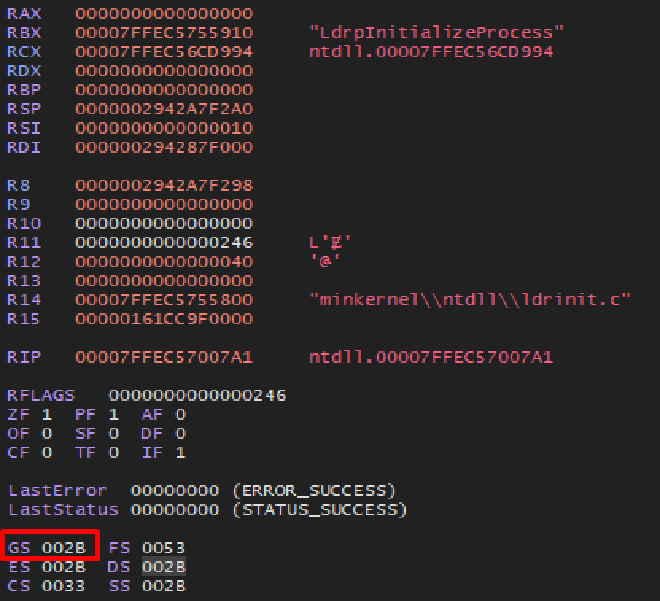
When inspecting the register further, the value held inside (002B) doesn’t seem to correlate to the TEB, nor does it seem to be a 64 bit address. It seems to be some sort of offset but nothing conclusive. In older Windows systems, how the TEB used to be held was through the Global Descriptor Table (GDT). This was an array of Segment Descriptor structures which contained information such as the base address and access rights for that memory region. The gs or fs registers would effectively be an offset to the GDT which would point to the base address of the TEB. However, for compatibility reasons, modern systems have a placeholder value within the gs register that points to a NULL GDT entry:
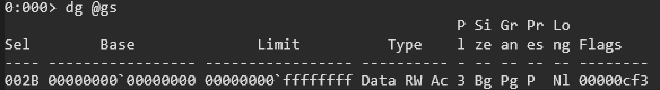
Notice the value 002B and it’s corresponding entry, is indeed NULL. For more clarity, the value in gs is called the Segment Selector and it not only works as an index, but also describes which table to use. That is because there is also a Local Descriptor Table (LDT) that can be used. Breaking the value within the gs register down, the first few bits describe which table to use and what properties it has. The latter ~13 bits are the actual offset for the specified table.
Getting to the base address of the TEB is a bit more involved. The base address is actually the base address of the gs register and the offset of the register describes the offset within the TEB. So gs[0x60], as seen in the previous article, is the base address of the gs register plus 0x60. However, because the register is available only to the kernel, user mode debugging won’t work. It will require debugging at ring 0. The execution flow diagrams presented in the first article show that when executing in user space, the gs register’s MSR is also in user mode and pointing to its corresponding TEB. The transition to kernel mode in the execution flow will also transition the gs MSR into its kernel level MSR using the swapgs syscall. Therefore, there are two key MSRs: IA32_GS_BASE which has an MSR number of 0xC0000101, and IA32_KERNEL_GS_BASE with an MSR number of 0xC0000102. The former being the user mode MSR and the latter being the kernel mode counterpart.
Extracting the base address of the gs register is fairly simple when debugging in kernel mode (ring 0). However it’s important to note that because debugging the register requires ring 0 level debugging, the corresponding kernel level MSR number is used rather than the user mode MSR number:
lkd> rdmsr 0xC0000102
msr[c0000102] = 000000f3`7e837000
Reviewing this result from WinDbg shows that this is the base address of the gs register and by extension, the base address of the TEB. This can be proven by showing the TEBs base address and comparing them. Notice how the addresses are the same:

Malware Mitigation #
I will conclude this series with how to mitigate against the technique I used to bypass Defender. The critical piece of information is how the shellcode was copied to the target process. Instead of using common remote process injection WinAPI calls, I used less common and lesser known calls that aren’t as prevalent. This means the technique isn’t as visible to the detection mechanisms because the engine isn’t used to seeing malicious activity corresponding to the calls. This could be improved by monitoring and analyzing changes detected within a process’s memory. However, the memory within a process changes quite frequently so using this method will consume a significant amount of resources on the system.
The detection could come with correlating two process’s talking to each other, specifically when one process is changing another processes memory and subsequently executing code within that memory region. The basic logic flow is that a process creates a new memory region within a target process, modifies it, and then executes it. As a result any logic flow similar to that should be highly scrutinized and analyzed to make sure it is not malicious.
Most EDRs already do this, but another big red flag is that notepad.exe, a local note taking application, is talking over TCP to a remote system on the network. This application should never do that and it is out of the ordinary to have that happen. The indicators of compromise will show that the application’s new thread, which started on the malicious shellcode, is calling out to a listener and subsequently running commands on the local system. Establishing a baseline is critical to knowing what is or is not normal. This can vary depending on the environment but it is well established that notepad.exe does not perform commands nor does it call out over TCP to a remote system.
If there are any questions, comments, or concerns on any article in the series, feel free to reach out.
~ Gr1dGh0st